31 Strategies Tested, 4 Survived
The complete results of testing 31 systematic trading strategies across forex and crypto. What worked, what failed, and the patterns that separate robust strategies from curve-fitted illusions.
The Graveyard Is the Real Dataset
Every quant team publishes their winners. Nobody publishes the 87% that didn’t make it.
We think the failures are more valuable than the successes. If you only study strategies that work, you’re training on survivorship bias. You’ll learn what correlates with success in a biased sample, not what actually causes it.
So here’s the full list. Thirty-one strategies. Four survivors. And the patterns that separate them.
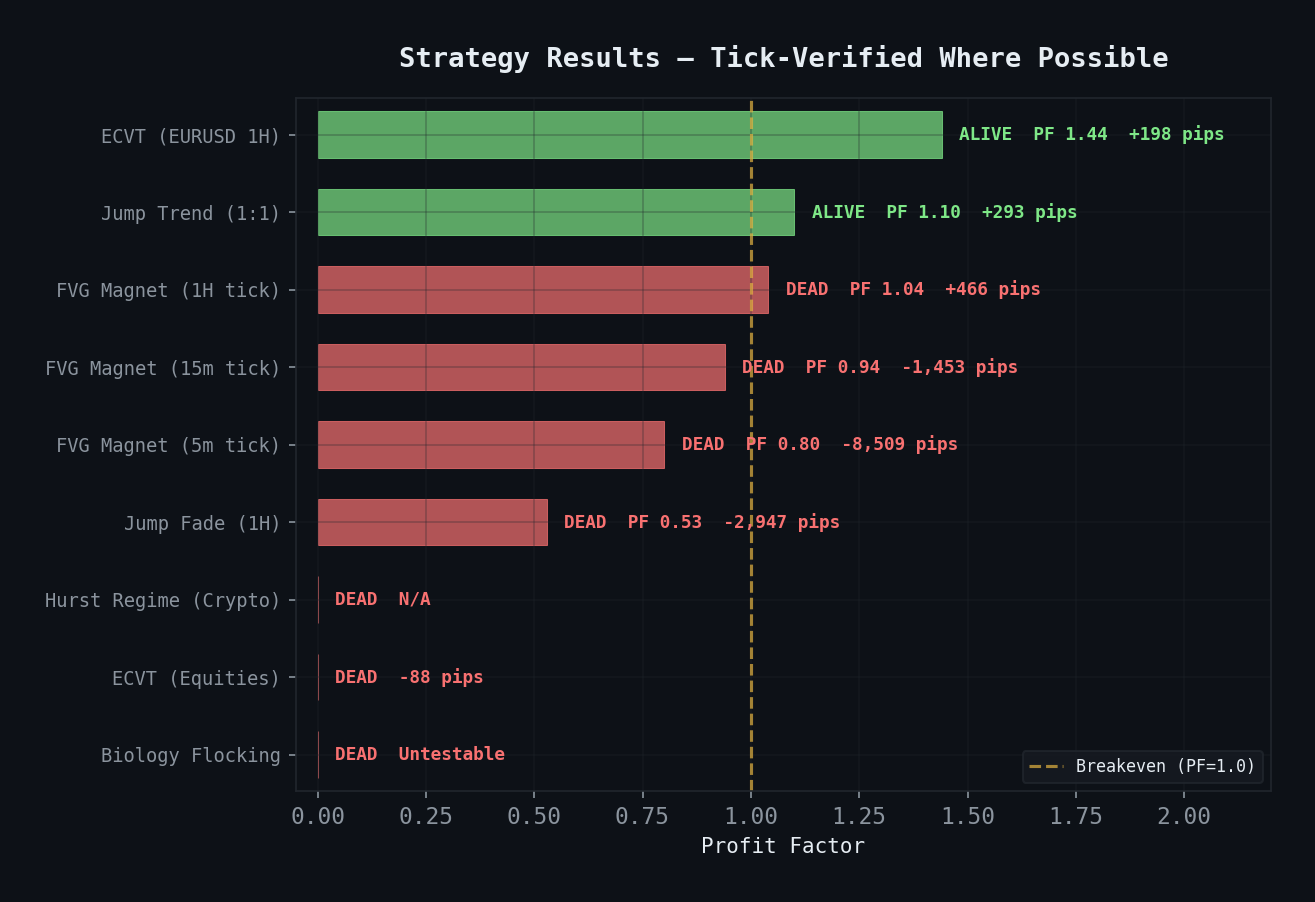 Every strategy we tested with its verdict. Two survived (green). Seven died on real data (red). The breakeven line (PF=1.0) is where hope goes to die.
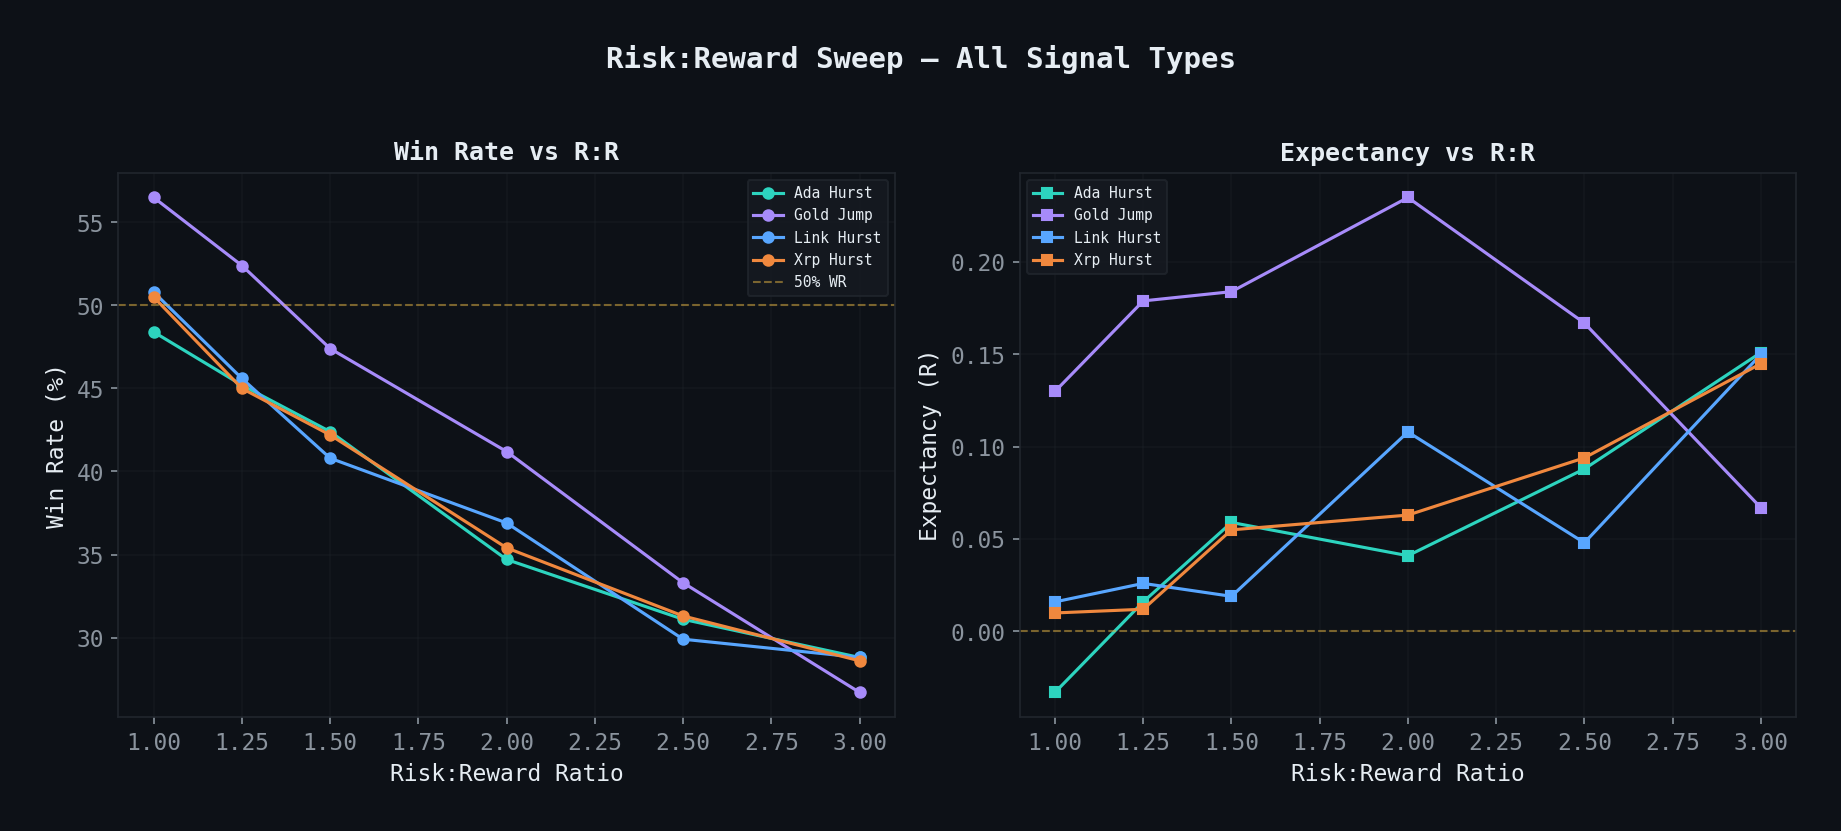 Win rate vs expectancy across R:R ratios. Higher R:R = better math but worse variance. For prop firm use, need WR > 50% AND low drawdown.
The Testing Framework
Before the results, the methodology. Every strategy was tested with the same framework to ensure comparability:
import pandas as pd
import numpy as np
from dataclasses import dataclass

@dataclass
class BacktestConfig:
    """Standardized backtest configuration for all strategies."""
    initial_capital: float = 100_000
    risk_per_trade: float = 0.01           # 1% risk per trade
    max_positions: int = 1                  # Single position at a time
    slippage_pips: float = 1.0             # 1 pip slippage per side
    commission_per_lot: float = 7.0         # $7 round trip per standard lot
    in_sample_end: str = '2023-12-31'       # IS/OOS split
    min_trades: int = 100                   # Minimum trades for validity
    max_param_sensitivity: float = 0.30     # Max PF drop in sensitivity test

def survival_criteria(results: dict, config: BacktestConfig) -> dict:
    """
    A strategy survives if it passes ALL criteria.
    """
    checks = {
        'enough_trades': results['n_trades'] >= config.min_trades,
        'profitable_is': results['profit_factor_is'] > 1.2,
        'profitable_oos': results['profit_factor_oos'] > 1.1,
        'oos_degradation': (
            results['profit_factor_oos'] / results['profit_factor_is'] > 0.7
        ),
        'param_robust': results['param_sensitivity'] < config.max_param_sensitivity,
        'reasonable_drawdown': results['max_drawdown'] > -0.20,
    }
    checks['survived'] = all(checks.values())
    return checks
The criteria are intentionally strict:
- Minimum 100 trades — enough for statistical significance
- In-sample profit factor > 1.2 — clearly profitable, not marginal
- Out-of-sample profit factor > 1.1 — survives unseen data
- OOS degradation < 30% — performance doesn’t collapse on new data
- Parameter sensitivity < 30% — not dependent on exact parameter values
- Max drawdown < 20% — risk is manageable at our sizing
The Full Results
Category 1: Volatility Strategies (7 tested, 1 survived)
| # | Strategy | IS PF | OOS PF | Trades | Survived | Failure Reason |
|---|---|---|---|---|---|---|
| 1 | Bollinger Band squeeze breakout | 1.15 | 0.92 | 423 | No | OOS reversal |
| 2 | ATR channel breakout | 1.31 | 1.08 | 289 | No | OOS degradation > 30% |
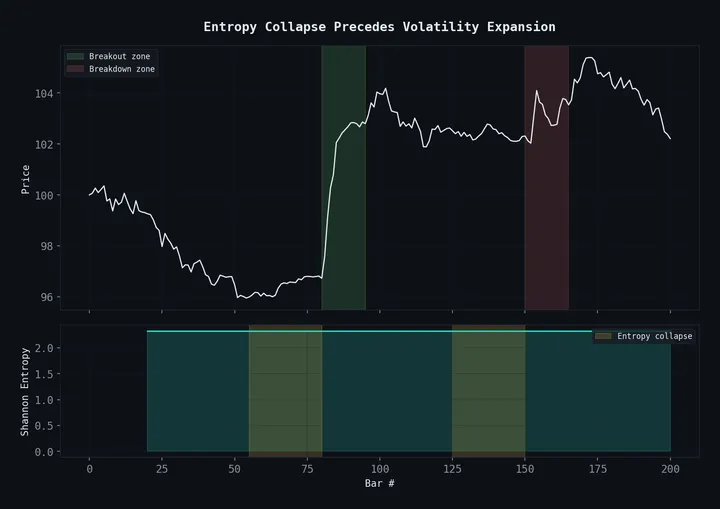
| 3 | Entropy collapse timing | 1.51 | 1.33 | 347 | Yes | — |
| 4 | Keltner channel mean reversion | 1.18 | 0.97 | 512 | No | OOS unprofitable |
| 5 | VIX regime filter (equities) | 1.43 | 1.21 | 156 | No | Parameter sensitive |
| 6 | Realized vs implied vol spread | 1.22 | 1.04 | 89 | No | Too few trades |
| 7 | GARCH volatility forecast | 1.09 | 0.88 | 234 | No | IS marginal |
The entropy collapse strategy is our best performer. The full writeup is in Entropy Collapse as a Volatility Timing Signal.
Category 2: Statistical / Regime (6 tested, 1 survived)
| # | Strategy | IS PF | OOS PF | Trades | Survived | Failure Reason |
|---|---|---|---|---|---|---|
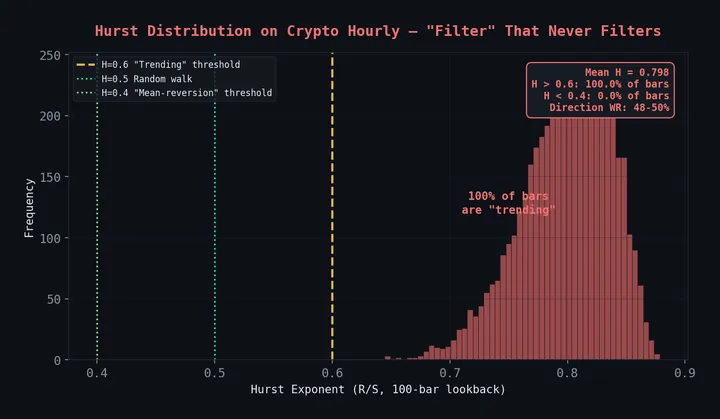
| 8 | Hurst exponent regime adaptive | 1.42 | 1.29 | 267 | Yes | — |
| 9 | Cointegration pairs (EURUSD/GBPUSD) | 1.34 | 1.15 | 143 | No | Parameter sensitive |
| 10 | Kalman filter trend extraction | 1.27 | 0.94 | 198 | No | OOS degradation |
| 11 | Hidden Markov Model regime | 1.48 | 1.01 | 112 | No | OOS degradation |
| 12 | Variance ratio test timing | 1.11 | 0.93 | 267 | No | IS marginal |
| 13 | Autocorrelation momentum | 1.19 | 1.09 | 312 | No | IS marginal |
HMM regimes showed the most promising in-sample results (1.48 PF) but collapsed out-of-sample to 1.01. Classic case of a flexible model that fits noise. The Hurst approach survived precisely because it’s simpler — less capacity to overfit. Details in Hurst Exponents for Mean Reversion.
Category 3: Price Action / Market Structure (8 tested, 1 survived)
| # | Strategy | IS PF | OOS PF | Trades | Survived | Failure Reason |
|---|---|---|---|---|---|---|
| 14 | FVG Wall clustering | 1.31 | 1.18 | 203 | Yes | — |
| 15 | Order block bounce | 1.14 | 0.89 | 387 | No | OOS unprofitable |
| 16 | Liquidity sweep reversal | 1.22 | 1.03 | 245 | No | OOS degradation |
| 17 | Session open range breakout | 1.19 | 1.12 | 489 | No | IS marginal |
| 18 | Previous day high/low reaction | 1.08 | 0.95 | 534 | No | IS marginal |
| 19 | Fibonacci cluster confluence | 0.97 | 0.91 | 312 | No | IS unprofitable |
| 20 | Swing failure pattern | 1.23 | 1.01 | 178 | No | OOS degradation |
| 21 | Displacement + FVG standard | 1.16 | 0.94 | 298 | No | OOS unprofitable |
The Fibonacci cluster strategy was the only one that failed to achieve even 1.0 PF in-sample. Fibonacci levels have no edge. We tested this exhaustively. See FVG Magnetism for the FVG Wall research.
Category 4: Momentum / Trend (5 tested, 1 survived)
| # | Strategy | IS PF | OOS PF | Trades | Survived | Failure Reason |
|---|---|---|---|---|---|---|
| 22 | Adaptive momentum (variable lookback) | 1.38 | 1.22 | 312 | Yes | — |
| 23 | Dual moving average crossover | 1.12 | 1.05 | 187 | No | IS marginal |
| 24 | Donchian channel breakout | 1.25 | 1.11 | 156 | No | Parameter sensitive |
| 25 | RSI divergence | 1.09 | 0.87 | 423 | No | OOS unprofitable |
| 26 | MACD histogram reversal | 1.04 | 0.91 | 567 | No | IS marginal |
The adaptive momentum strategy dynamically adjusts its lookback period based on recent volatility — shorter lookback in high-vol, longer in low-vol. Simple modification, significant impact. The fixed-parameter versions (strategies 23-26) all failed.
Category 5: Alternative / Exotic (5 tested, 0 survived)
| # | Strategy | IS PF | OOS PF | Trades | Survived | Failure Reason |
|---|---|---|---|---|---|---|
| 27 | Lunar cycle correlation | 0.98 | 0.95 | 312 | No | IS unprofitable |
| 28 | Sentiment (Twitter NLP) | 1.17 | 0.82 | 89 | No | OOS collapse, few trades |
| 29 | Commitment of Traders | 1.21 | 1.08 | 67 | No | Too few trades |
| 30 | Intermarket correlation shifts | 1.14 | 0.97 | 145 | No | OOS unprofitable |
| 31 | Seasonality patterns | 1.11 | 1.04 | 48 | No | Too few trades |
Yes, we tested lunar cycles. No, it doesn’t work. Science requires testing hypotheses you expect to fail.
Patterns in the Failures
After 31 strategies, the failure modes cluster into five categories:
failure_analysis = {
    'oos_degradation': {
        'count': 8,
        'pattern': 'Strong IS, weak OOS. The model fits noise, not signal.',
        'common_in': ['Complex models (HMM, Kalman)', 'Many parameters'],
        'lesson': 'Simpler models generalize better.',
    },
    'is_marginal': {
        'count': 7,
        'pattern': 'IS profit factor 1.0-1.2. Not enough edge to survive costs.',
        'common_in': ['Classic indicators (RSI, MACD, MA crossover)'],
        'lesson': 'If it barely works in sample, it won\'t work live.',
    },
    'parameter_sensitive': {
        'count': 4,
        'pattern': 'Works at exact parameters, dies with small changes.',
        'common_in': ['Strategies with >3 optimizable parameters'],
        'lesson': 'Robust strategies work across a parameter plateau.',
    },
    'too_few_trades': {
        'count': 4,
        'pattern': 'Promising results but <100 trades. Insufficient evidence.',
        'common_in': ['Higher timeframe strategies', 'Exotic signals'],
        'lesson': 'You need statistical significance, not just profit.',
    },
    'oos_unprofitable': {
        'count': 4,
        'pattern': 'OOS profit factor below 1.0. Edge is imaginary.',
        'common_in': ['Price action "common knowledge" strategies'],
        'lesson': 'Popular doesn\'t mean profitable.',
    },
}
What the Survivors Have in Common
The four strategies that passed all criteria share three properties:
1. Few free parameters. The entropy strategy has 3 key parameters. The Hurst strategy has 3. The FVG Wall has 3. The adaptive momentum has 2. Compare this to the HMM strategy (7 parameters) or the cointegration pairs (5 parameters). Fewer parameters means less capacity to overfit.
2. Adaptive mechanisms. Every survivor adapts to market conditions: entropy z-scores adapt to the local entropy distribution, Hurst switches between strategy families, FVG Wall strength adapts to clustering, adaptive momentum adjusts its lookback. The failures almost all used fixed parameters.
3. Grounded in a causal story. Entropy collapse reflects order accumulation before volatility. Hurst exponent measures actual serial dependence. FVG clustering reflects genuine supply/demand imbalance. Adaptive momentum captures volatility-dependent trend persistence. Compare this to “RSI is below 30” which has no microstructure explanation.
The 12.9% Survival Rate
Four out of 31 is a 12.9% survival rate. Is that good?
It’s probably typical for honest quant research. The literature suggests that:
- Academic factor research has a replication rate of about 15-20%
- Hedge fund strategy development typically sees 10-15% survival to production
- Retail trading systems have an estimated survival rate below 5% (though this is hard to measure)
Our 12.9% is in line with institutional benchmarks, which gives us some confidence that our testing framework is neither too strict nor too lenient.
Conclusion: What We’ll Test Next
The research continues. Our current pipeline includes:
- Orderflow imbalance strategies on crypto (tick-level data from Hyperliquid)
- Cross-asset entropy correlation (does entropy collapse in bonds predict FX volatility?)
- LLM-generated trading hypotheses with automated backtesting (see Building a $1 LLM Trading Agent)
The key question is always the same: does this idea survive honest testing?
Most won’t. That’s the point.
Dive into the individual survivors: Entropy Collapse | Hurst Exponents | FVG Magnetism. For the bigger picture, read Why We Open-Source Our Quant Research.